





AI
AI Analytics for Coaches: Turning Match Data Into Next Week's Training Plan
Dashboards do not improve athletes. The useful output of sports analytics is a specific change to what an athlete does on Tuesday.
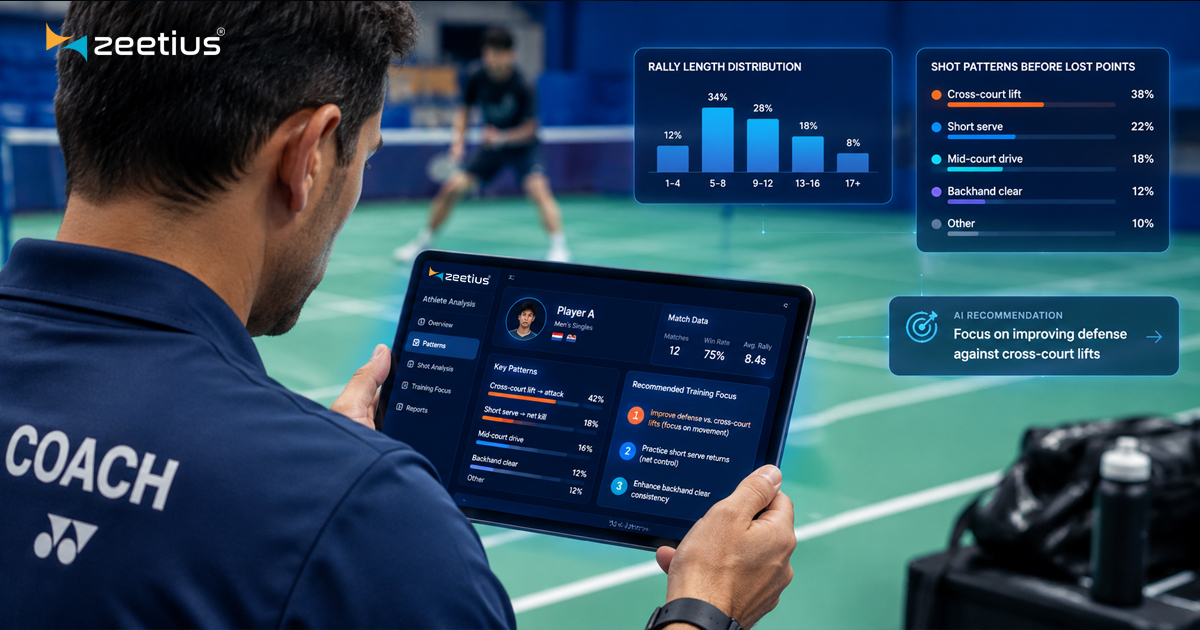
Most sports analytics products fail at the same point. They produce a beautiful dashboard, the coach looks at it twice, and then never opens it again.
The reason is not that coaches dislike data. It is that a dashboard answers "what happened" when the only question a coach actually needs answered is "what should we do differently on Tuesday." Those are separated by a large amount of interpretive work, and if the product does not do that work, the coach has to — on top of coaching.
The three-step gap
Between a match result and a training decision there are three steps, and analytics products almost always stop after the first.
- Description. You lost 21-18, 19-21, 15-21. Your average rally was 6.4 shots. You won 62% of rallies under four shots and 31% of rallies over ten. This is where most products stop.
- Diagnosis. The long-rally deficit is not conditioning — your movement speed holds up. It is that in extended rallies you revert to a cross-court clear from the backhand corner, and against this opponent that reliably yields the attack.
- Prescription. Two sessions this week on backhand-corner options under fatigue, specifically the straight drop and the down-the-line clear, with rally-length constraints so the pattern is trained where it fails.
ZetAI Coach is built to get to the third step. The first two are a means to it, not the product.
Patterns, not averages
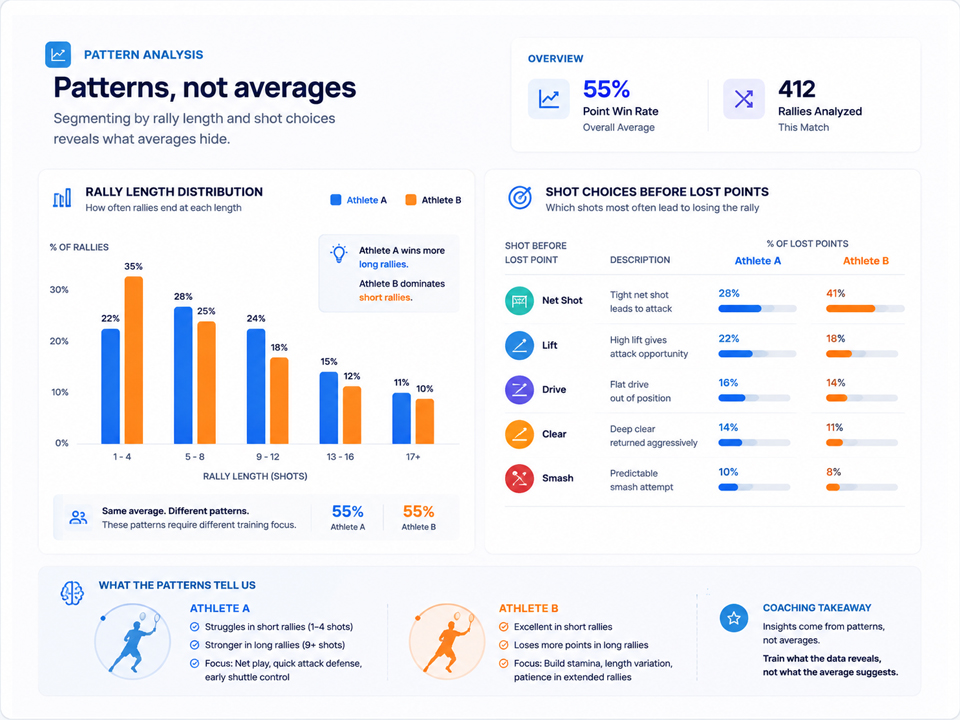
Averages hide almost everything that matters in racquet sport. An athlete with a 55% point-win rate could be dominating short rallies and collapsing in long ones, or the reverse, and those two athletes need opposite training weeks. The analysis segments by rally length, score pressure, court position and stage of match, because that is where a coach's actual decisions live — and it is why the output is a distribution rather than a number.
Where the data comes from
Three sources, and the mix determines how much you get.
Scoring data exists for every match on the platform: point sequences, timing, who served, what the score was. This alone supports rally-length analysis, momentum, pressure-point performance and scoring patterns — and it needs no extra hardware at all, which is why every athlete gets it.
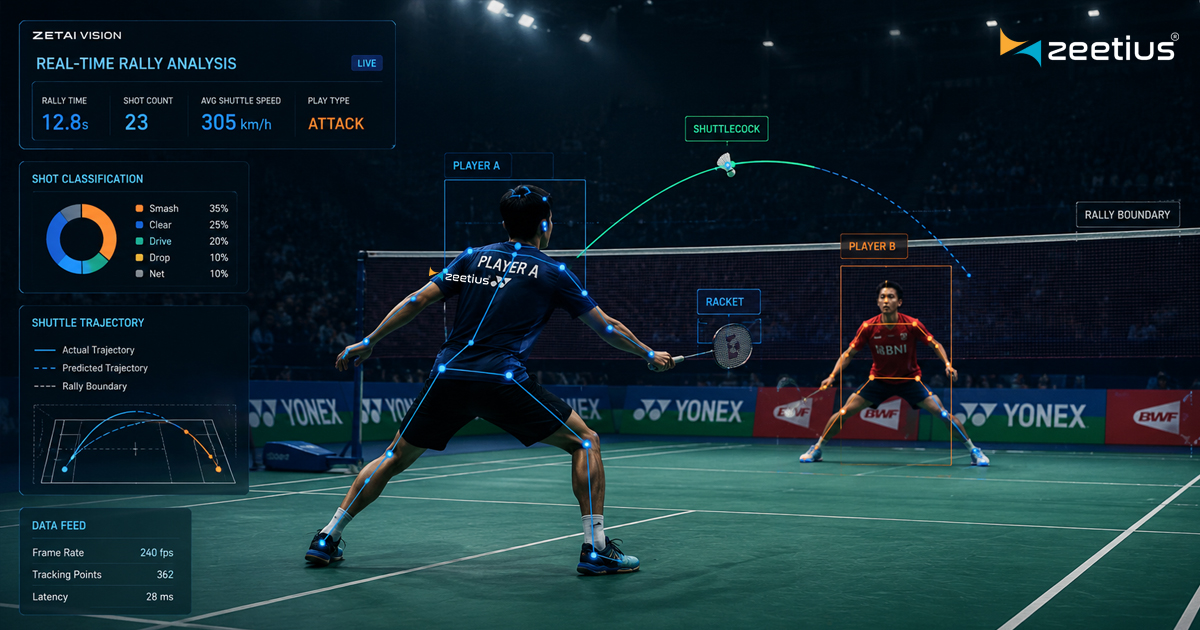
Vision data, where ZetAI Vision is deployed, adds shot classification, court coverage and movement quality. That is what makes the diagnosis step specific rather than inferred.
Academy data from Zeetius Academy — attendance, session load, training history — is what turns a diagnosis into a plan that fits the athlete's actual week rather than an idealised one.
The coach stays in charge, for a good reason
Every recommendation is presented with the evidence that produced it and can be dismissed. That is not a hedge — it is because the model is missing most of the context that determines whether a recommendation is sensible.
It does not know the athlete is carrying a niggle, that they respond badly to being told they have a weakness in a group session, that exams are in three weeks, or that the real problem is confidence rather than technique. A coach knows all of that. The model's job is to notice the pattern in ten matches that no human has time to review, and hand it over with the working shown.
Start with what you already have
The most common mistake is waiting for cameras. If your athletes compete in tournaments run on Zeetius, the scoring data already exists and the analysis is already there — going back through every match they have played on the platform. That is enough to find the majority of pattern-level problems. Add vision later, for the athletes where the extra resolution justifies it.