






AI
Win Probability, Explained: What the Number Actually Means
A 92% win probability is not a prediction. It is a statement that players in this position have historically won 92 times in 100 — and that matters.
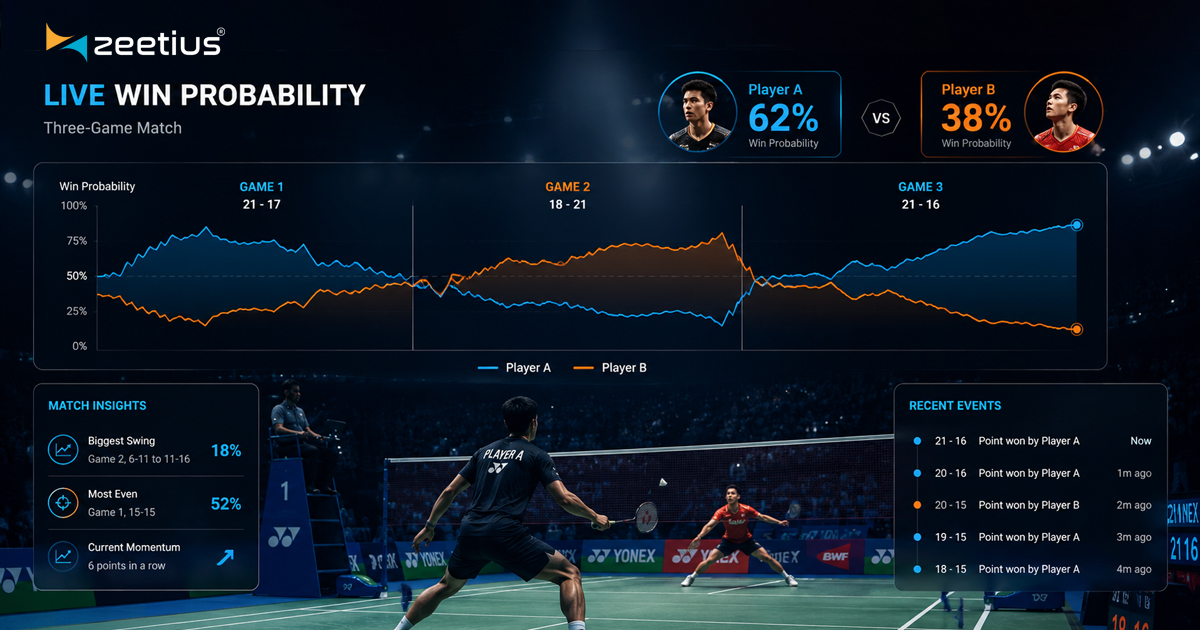
Put a win probability on a live scoreboard and two things happen immediately. Engagement goes up, and somebody in the comments points out that the model said 92% for a player who then lost.
The second reaction is the more interesting one, because it reveals a genuine misunderstanding about what the number is — and one the industry has generally not bothered to correct.
It is a frequency, not a forecast
When ZetAI Predict says 92%, it is making a specific, testable claim: across all the historical situations resembling this one, the player in this position went on to win 92 times out of 100.
Which means that in eight of those hundred, they lost. A model that says 92% and is correct will be wrong roughly one time in twelve. If it were never wrong at 92%, the number would be broken — it should have said 99%.
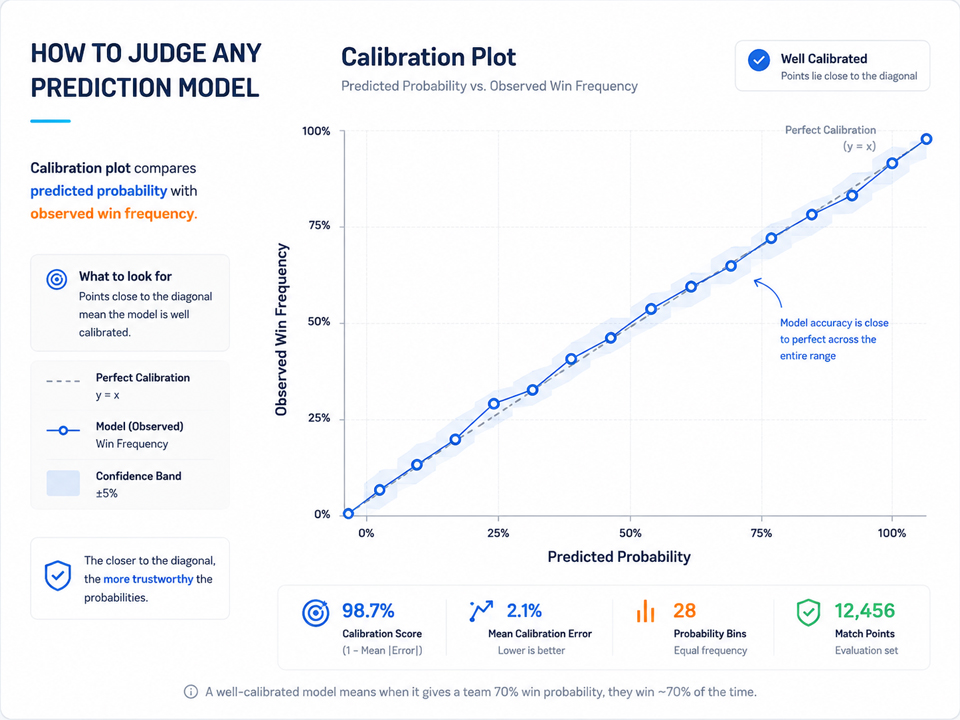
This is why we evaluate the model on calibration rather than accuracy. Take every moment the model has ever said 70%; the player should have won almost exactly 70% of them. A model that is confidently wrong in a consistent direction is far more dangerous than one that is uncertain, because it looks authoritative.
How to judge any prediction model
This is the chart to ask any sports AI vendor for. Predicted probability on one axis, observed frequency on the other. A well-calibrated model sits on the diagonal. Almost nobody publishes this, because headline accuracy on a curated test set is a much friendlier number — and it is the one that tells you least about whether the model can be trusted on a match you care about.
What the model actually looks at
Naively, win probability is a function of the score. In practice the score is a surprisingly weak signal on its own — 11-8 in the second game means completely different things depending on how the first game went and who is serving.
- Score state — points, games, and critically how much of the match remains for a deficit to be recovered in.
- Serve — worth more in some sports than others, and worth most at specific score states.
- Momentum — recent point sequences, which carry real predictive signal in racquet sports beyond what the raw score contains.
- Player priors — historical form, head-to-head record and rating, weighted down as the match progresses and live evidence accumulates.
- Match context — round, event, stage of tournament, and rally-length patterns so far.
Each sport has its own model. A one-point deficit in table tennis at 9-10 in a deciding game is a very different situation from a one-point deficit in badminton at 19-20, which is different again from being one point down in wrestling with twenty seconds left.
Why it is worth having on screen
For spectators, it does what a good commentator does: tells you when to pay attention. A probability that moves twenty points in three rallies is a signal that something just happened, and on a multi-court page it is the fastest way to find the match worth watching.
For broadcast, the swing is the highlight trigger — the biggest probability movements in a match are, almost by definition, its key moments, which is how automatic highlight generation decides what to clip.
For coaches, the retrospective curve is more useful than the live number. Where did the match turn? Was there a single collapse or a slow drift? Did the athlete's probability consistently fall at the same score state across five matches? That last question is a coaching insight the scoreline alone will never surface.
Where we will not put it
We do not surface win probability in junior age categories by default. A fourteen-year-old does not need a screen telling the hall they have a 6% chance while they are still playing, and the coaching value does not outweigh what that does to a young athlete. It is available to coaches afterwards, in the retrospective view, which is where it is useful anyway.